Debugging Core Data
This blog post is just a short overview of the tools that I am using when working with Core Data.
Launch Arguments
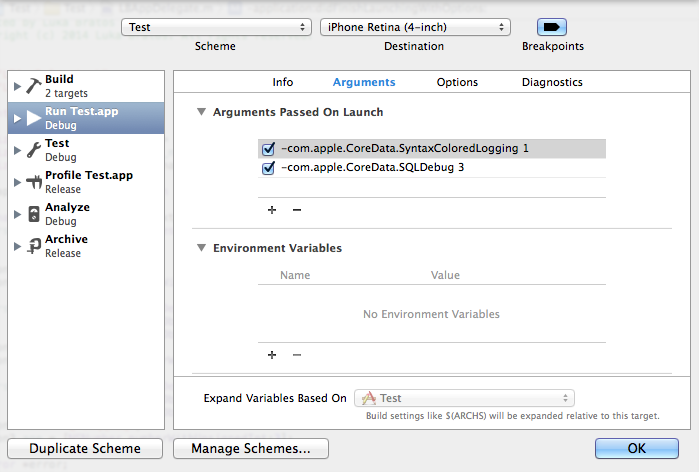
To enable launch arguments for your app select your target from the Xcode toolbar and select Edit Scheme.
You’ll see this menu:

Any argument passed on launch will override the current value in NSUserDefaults for the duration of execution.1
Here are some options if you’re using SQLite as your persistent store:
-com.apple.CoreData.SQLDebug [1,2,3]
This option allows you too see actual SQL statements sent to the persistent store used by Core Data. Verbosity of the output can be controlled by setting the value from 1 to 3. Higher the number more SQL output you’ll see.
-com.apple.CoreData.SyntaxColoredLogging 1
With this option you can turn on the syntax coloring.
-com.apple.CoreData.SQLiteDebugSynchronous [0,1,2]
Control the way in which data in a SQLite-based store is written to disk. With 0 disk switching is switched off. 1 means normal and 2 is the default.
-com.apple.CoreData.SQLiteIntegrityCheck 1
With this option SQLite store does extra integrity checking if set to 1.
-com.apple.CoreData.ThreadingDebug [1,2,3]
This option enables assertions to enforce Core Data’s multi-threading policy. Higher value enables more debugging.
SQLite
There are many tools available for viewing actual SQLite that is stored in application’s Documents directory.
In the simulator .sqlite is located at:
~/Library/Application Support/iPhone Simulator/X/Applications/XXXX-XXXX-XXXX-XXXX/Documents where X is your deployment target.
To simplify the process you can download app called SimPholders. It is a small utility for fast access to your iPhone Simulator apps. Or you can use awesome debugging toolkit called PonyDebugger.